Sisu’s integration with Google’s Looker
As the only full-time, in-house designer at the time, I was responsible for leading design efforts in our integration with Google’s analytics product, Looker.
This was a fast moving project with lots of moving parts, requiring navigating ambiguity, lots of self direction, and frequent and clear communication and cross-functional collaboration.
My role: Lead product designer
Impact:
Launched the integration’s private beta
Designed GA product
Created a cohesive visual design identity, combining Looker and Sisu’s design system
Why partner with Looker?
Joining these two analytics experiences would enable users to uncover a more streamlined and robust understanding of the “what” and the “why” behind their businesses. Additionally, connecting these platforms would be mutually beneficial by adding more depth to Looker’s capabilities and driving a new customer base to the Sisu platform while also driving revenue both both companies.
Sisu and Looker users are interested in exploring their data to find compelling insights to tell the story of their business. Data scientists, data analysts, and business analysts share these common struggles:
Quickly identifying areas to explore that impact business trends, drivers of their business, and growth deterrents
Knowing where to look for supporting data that correctly demonstrates the story of their business
Translating data and insights into a compelling story that can be used to drive decision making
Getting the data into Sisu
Designing an easy onboarding flow for all users coming from Looker was critical to ensuring a successful integration.
Designing the pop-up experience was the meat of the project, but, if users weren’t able to connect their databases to Looker in a seamless and low-friction way, we risked losing customers before having the opportunity to provide them with any value.
Looker’s documentation for connecting the database had many complicated steps that an average business user or administrator may not have felt comfortable doing. My job, as an advocate for the user, was to create a simple and easy onboarding flow that would enable analysts to get up and running as quickly as possible.
Some of the biggest goals for this flow was to eliminate unnecessary and highly technical steps which had the potential to overwhelm users and result in their abandoning the flow. In order to get users to the main experience, I had to make sure they could easily and successfully connect their data source.
To support a simple database connection, I made the following decisions with my team:
Limit database integrations to Snowflake and BigQuery to start
Use progressive disclosure to delineate a clear path to account and database connection (to reduce drop-off rates)
Remove unnecessary and confusing steps that could lead a user to abandon the flow, and ultimately, to an unsuccessful connection and an unconverted Looker user

Using progressive disclosure clarified the steps and their order for connecting a database to support a successful database connection

Complete the communication feedback loop with the user, ASAP
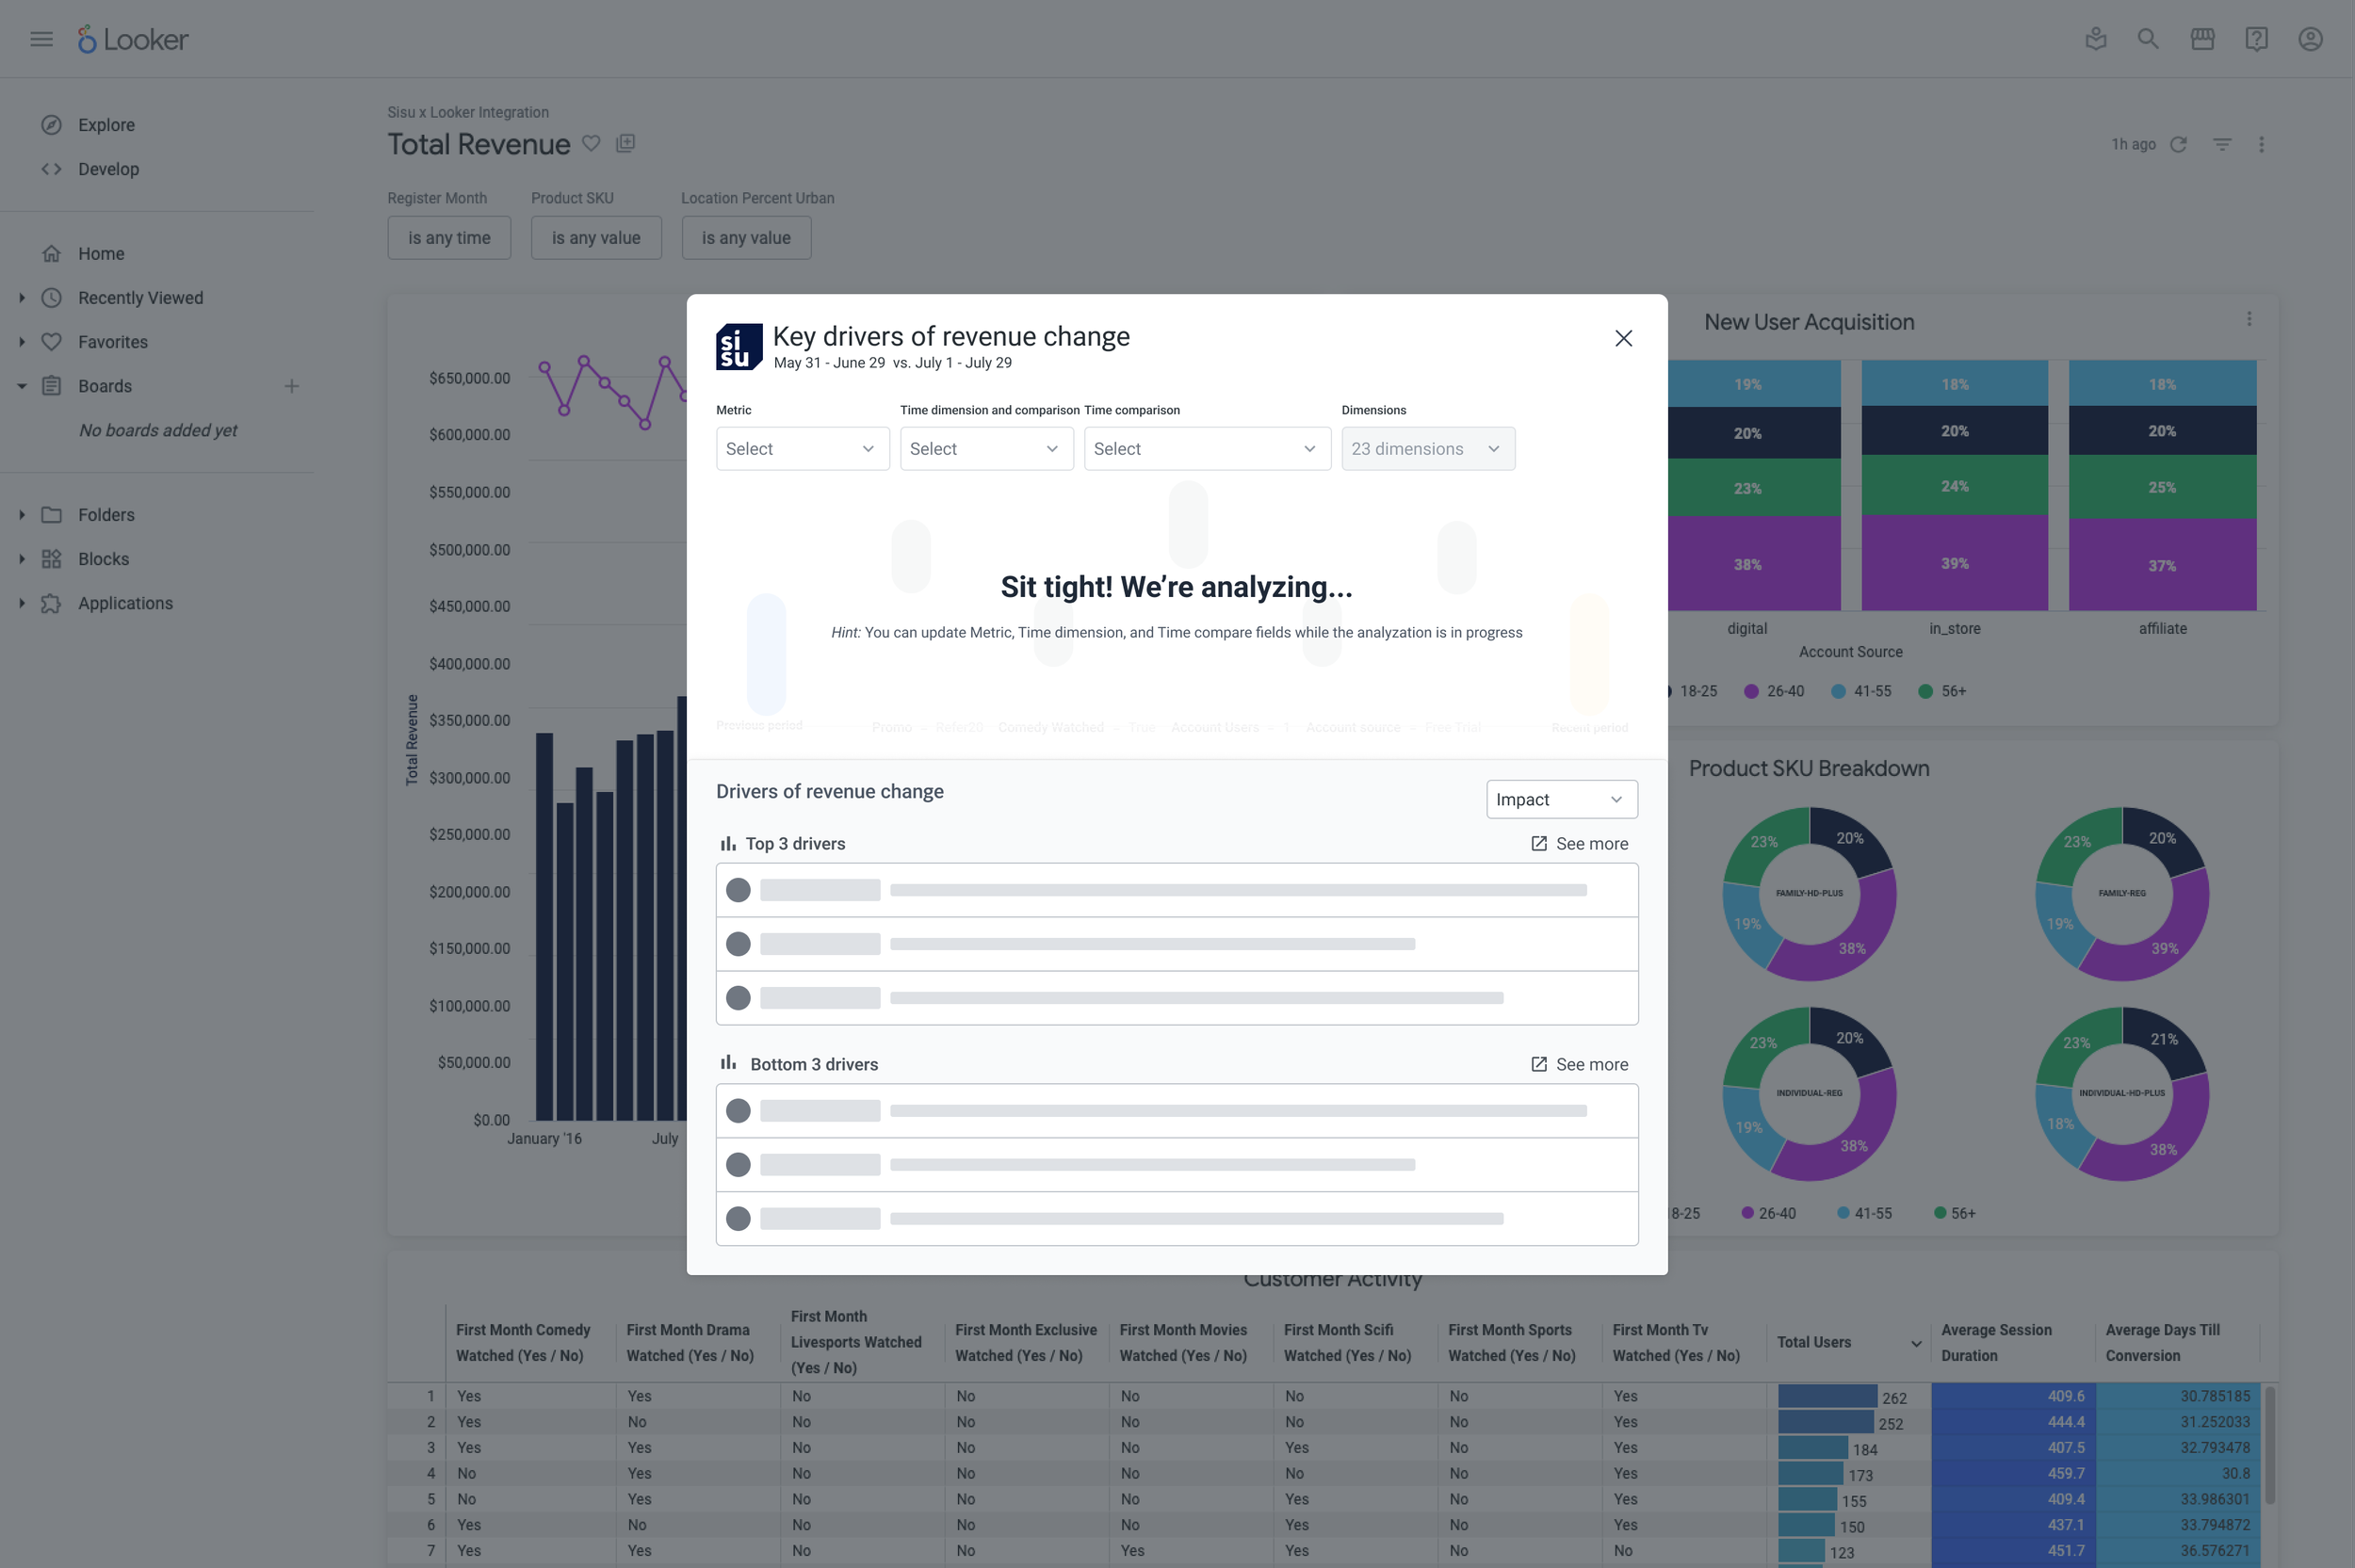
After connecting a user’s datasource to Looker, our next challenge was reducing overall time to value by providing them with valuable insights into their data as quickly as possible. Sisu’s main value proposition is quickly surfacing the “why” behind the “what” in their data. It’s our responsibility to give them those insights as soon as they’ve been successfully onboarded and as soon as they’ve clicked the “See Sisu insights”.
However, getting insights quickly can be hindered by many factors. For example, data can be slow to load, there could be database issues, or, in this case, there could have been problems on the Looker side that impacted Sisu results. Regardless of technical issues, we couldn’t risk creating a bad first impression with new users. Even if data load times were slow and out of our control, we had to find a way to keep the user engaged.
From the first moment of engagement, our metrics for success included:
Communicate with the user to let them know what was happening with their data
Use loading bars to indicate that progress was being made in analyzing their data
Allow the user to make changes to the Metric and Time dimensions while the analyzation was in flight
These intentional design decisions were made to keep the user engaged, to generate excitement about the results, and to encourage them to stay while their data loaded to see the final result.
Re-thinking and re-working the original flow
The team had created some early flows going from the Looker dashboard to the Sisu experience. We designed an starting point, the “happy path.” This was in an effort to get some anchors down in terms of what this experience would entail. We showed the .gif you see above (the “happy path”) at the Google Cloud Conference in 2022 to officially announce our partnership with Looker. However, after the conference, it was my responsibility to improve the flow, update the overall story, and to create a UX that would excite and interest our end users.
To do this, I created a flow chart of the original experience of going from Looker to Sisu and, with the team, we began to remove superfluous and unnecessary steps. We also narrowed the scope of the offering to accommodate for engineering bandwidth, our fast approaching deadlines, and, to create a more focused user experience.

Mapping out and reworking the Sisu/Looker pop-up UX and interactions
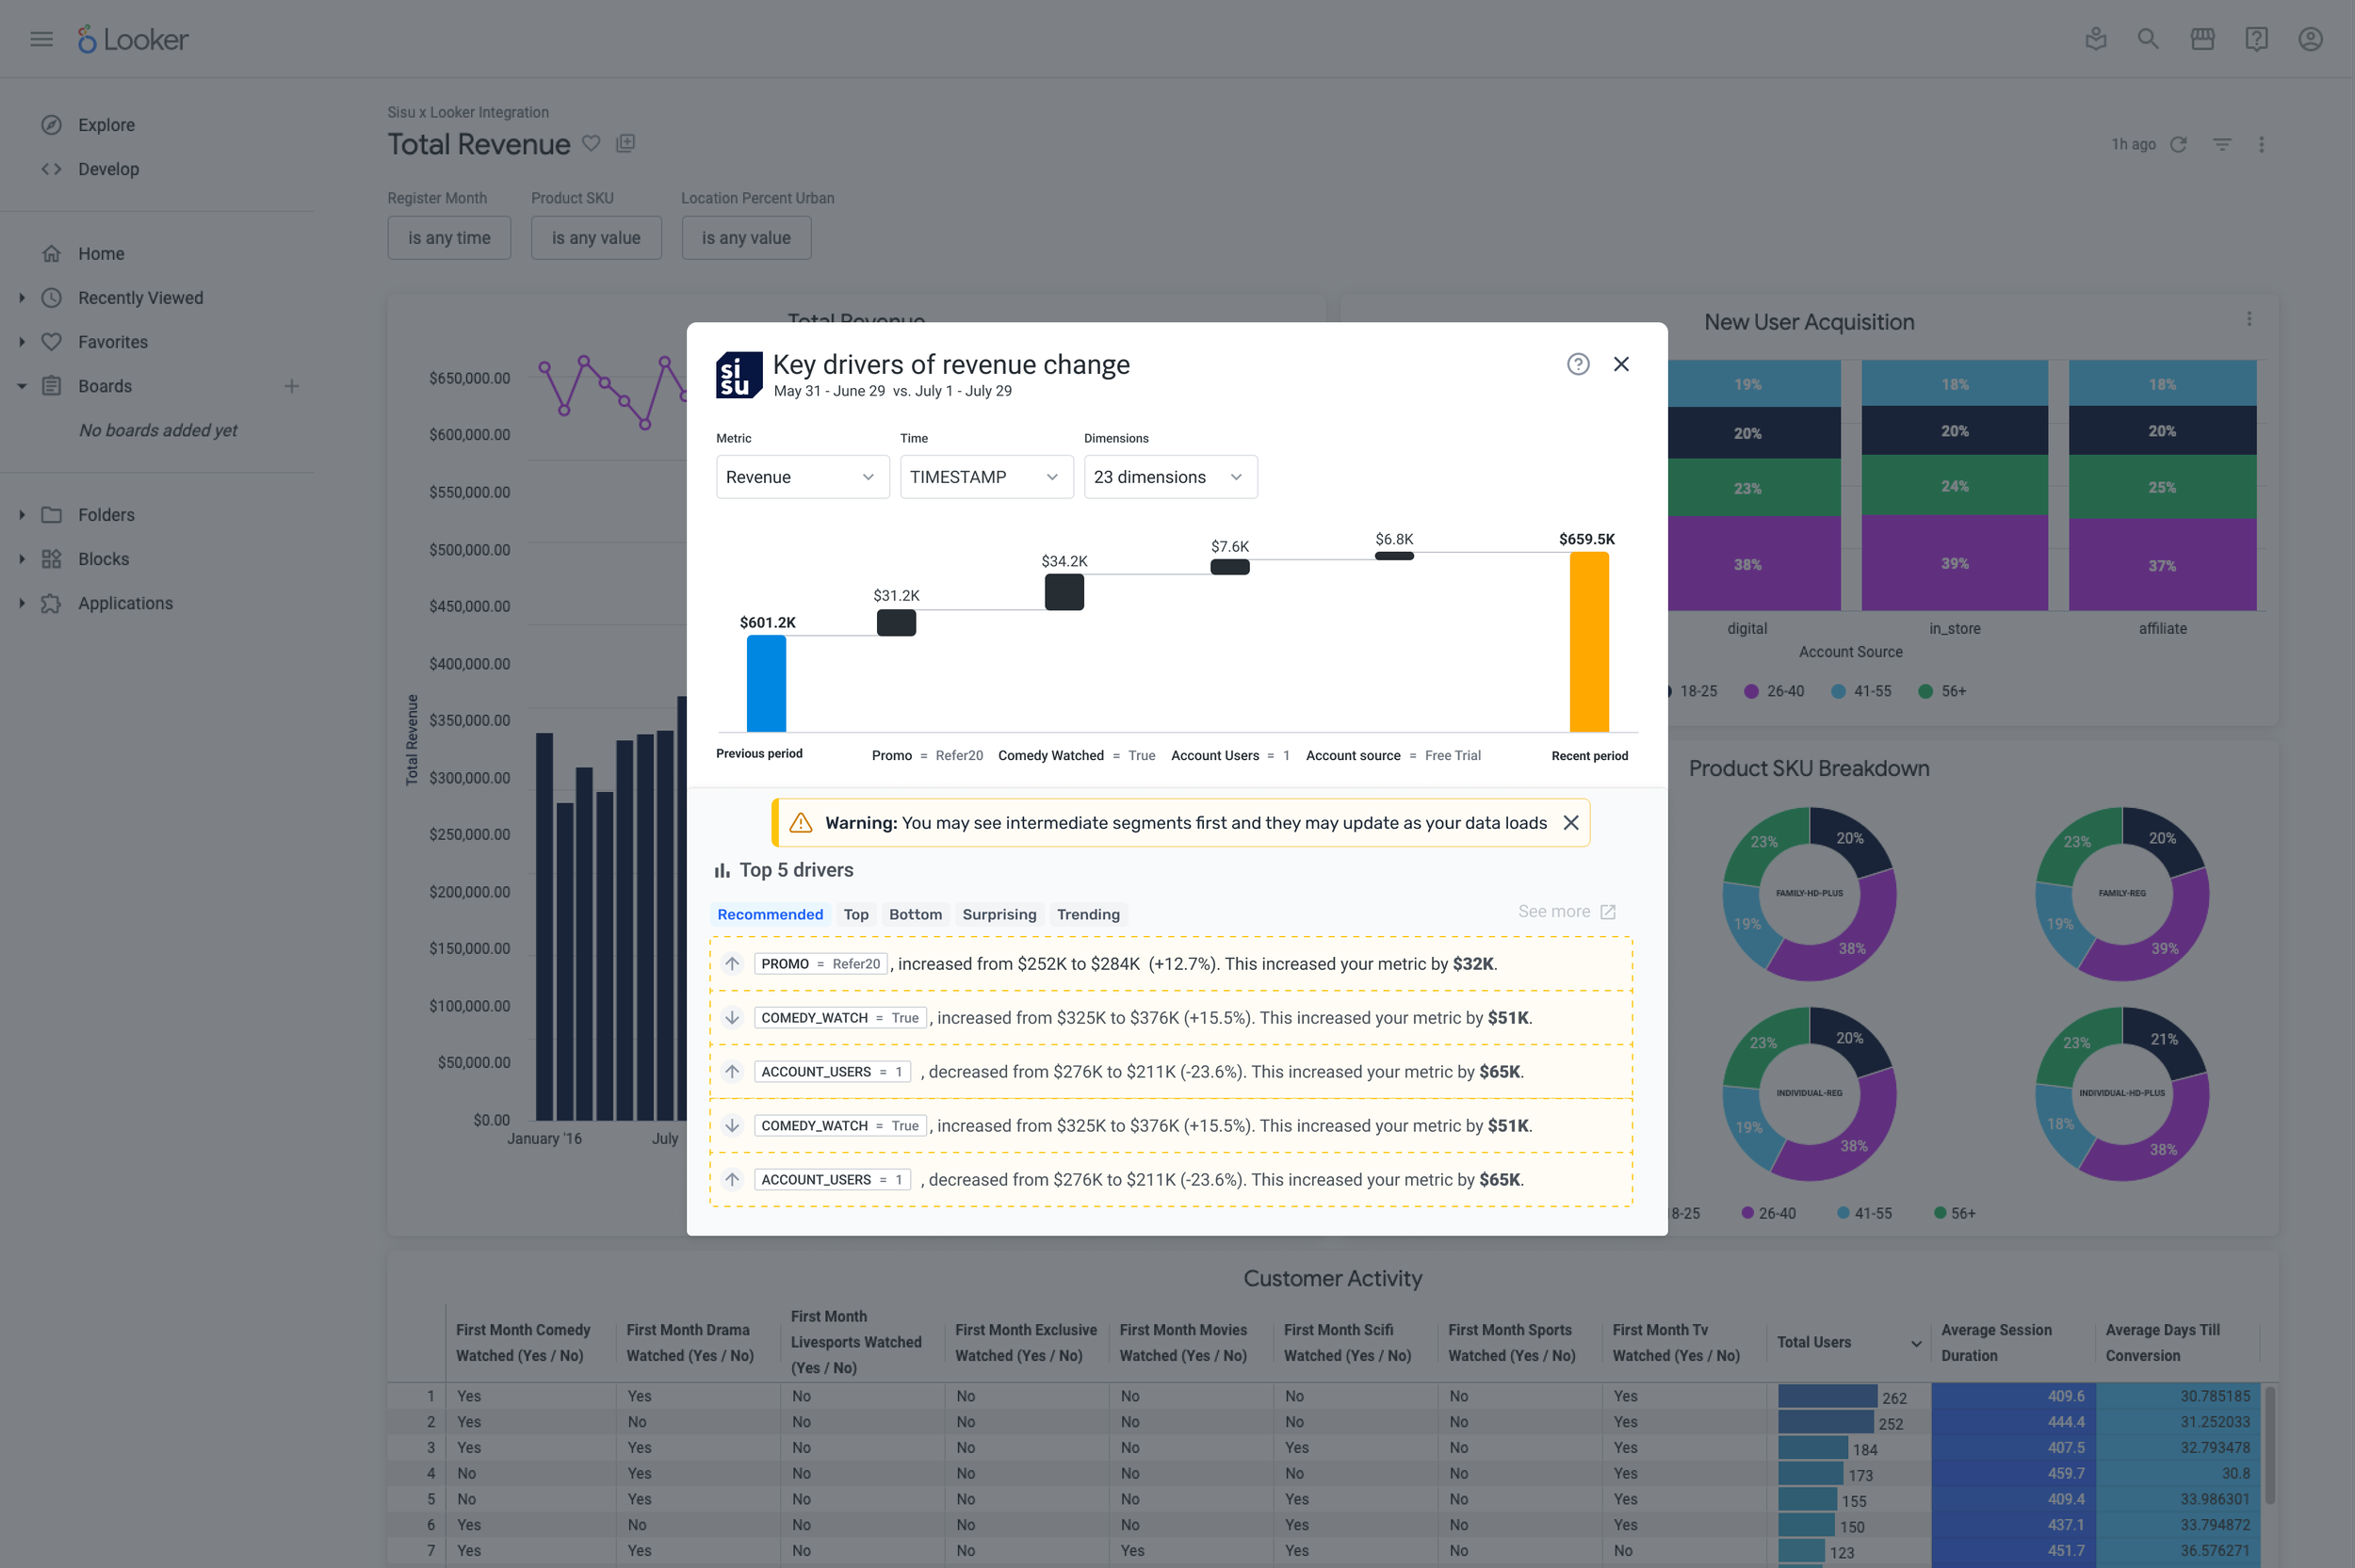
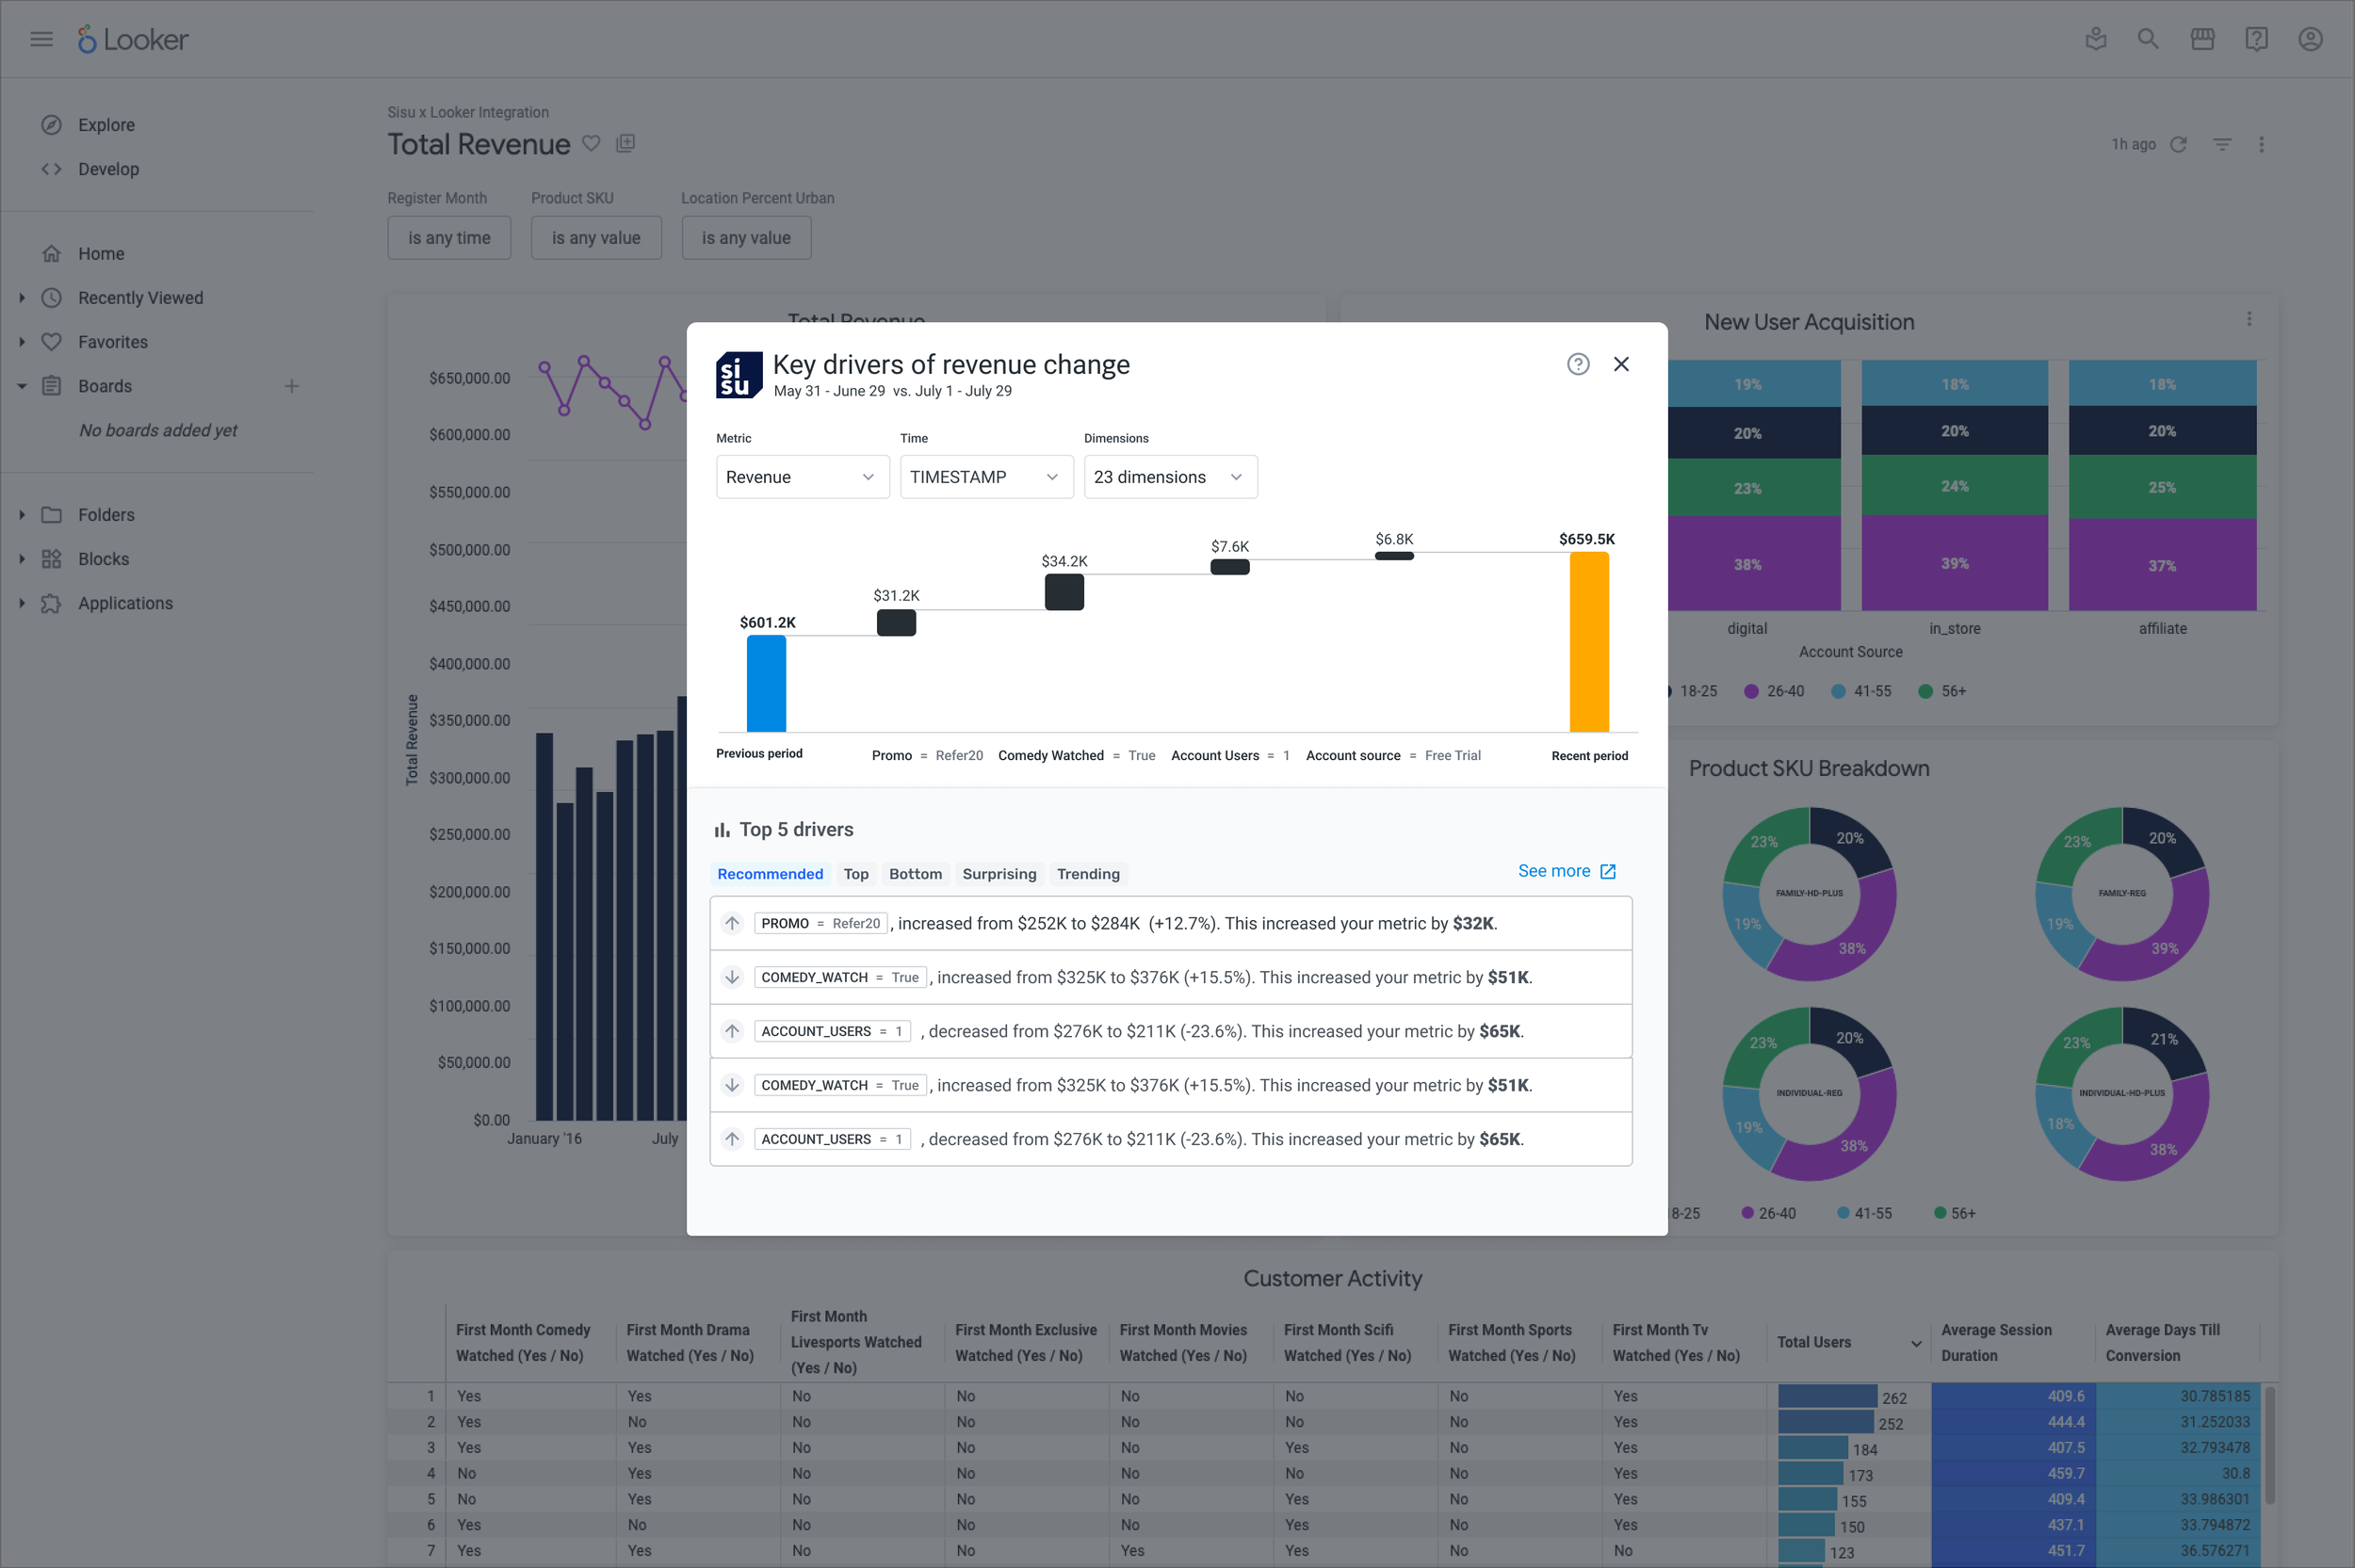
I designed the waterfall chart in a way that pared the content and visuals down to just the essentials. This, coupled with "Quick filters”, gives users a new view of their data while also enabling them to make changes and updates to find additional insights, without leaving the page.
Give the user something they’ve never seen before
The idea of connecting analytics tools can be a powerful experience for analysts. However, the product offering needs to get many things right in order to be useful and ultimately, successful for the end user. By connecting Sisu to Looker, we had to use their metrics and data as our starting point. This raised a few challenges and constraints:
First, we had to leverage the same dataset they were using in Looker. For us, that meant that we had to:
Use the same data to tell a new story - How could we provide the user with a new experience they’ve never seen before using the same data that they’ve always relied on?
We also had to show powerful data visualizations without overwhelming them with data. - What would the best way to surface something new, meaningful, and valuable?
How could we provide enough information to generate interest and curiosity? One metric for success meant providing value (new insights, exploring their data in a new way, and/or enabling users to find business insights or to make business decisions, faster) to the end user .
Solving for all of these areas in an 800x800 px pop-up was not an easy task. From a design perspective, we faced the added challenge of keeping the visual story connected as the user switched over from Looker to the Sisu popup, keeping the data story connected, and successfully introducing the user to a new UI without confusing or deterring them.
Private beta launch
We went through many iterations of what this pop-up experience could be, should include, and what we should launch. We chatted with customers along the way to validate our direction and decisions and our teams collaborated very closely to achieve as many user and business goals as possible.
Our explorations included limited the number of rows in the table to the top and bottom three drivers with the goal of making it easy for users to find new insights and to understand their data. However, we later learned, through customer conversations, that seeing the Top 5 drivers wasn’t compelling or new information. It was something that the user already had a sense for. This type of feedback drove the next rounds of design iterations and our table expanded to include more rows and columns of data so the user could explore their dataset more deeply, to enable users to contextualize what they were seeing, and to provide users with information and data they may not have seen before.
Brining in more information added to the constant tension we were playing with when it came to providing more information to the user without creating overwhelm. To create a cleaner visual aesthetic, I broke up to text walls using thermometer charts and centered the numbers to create more white space.
Our private beta was successfully launched in April 2023 to a handful of customers. Our waitlist continued to grow and we ultimately had to put a cap on the number of customers we were able to onboard.


Future explorations
After our private beta launch, we used customer feedback to influence the next phase of iterations. We learned that customers, once accustomed to the early data views, wanted to access more depth in their data. To do this, I explored designs that surfaced presented users with our segment detail card without having to click into a segment row or any other area of the pop-up. In our original designs, we created the experience within an 800x800 px modal but learned over time that this offering wasn’t large enough to accommodate the amount of data customers needed. There was always the constant tension in deciding how much information to show vs. leave out/keep nested in rows or tables. Too much information would overwhelm new users while not enough information would create a lackluster experience.
I explored multiple variations of webapp layouts and we also explored ways to bring in conversational AI into this experience. We were on track to launch our GA this past October but Sisu was acquired by Snowflake and the project was put on hold.